Overview
The Overview page is available in both ASCERA and CUIComply. Regardless of which platform you're using, the layout and functionality of this page remain the same.
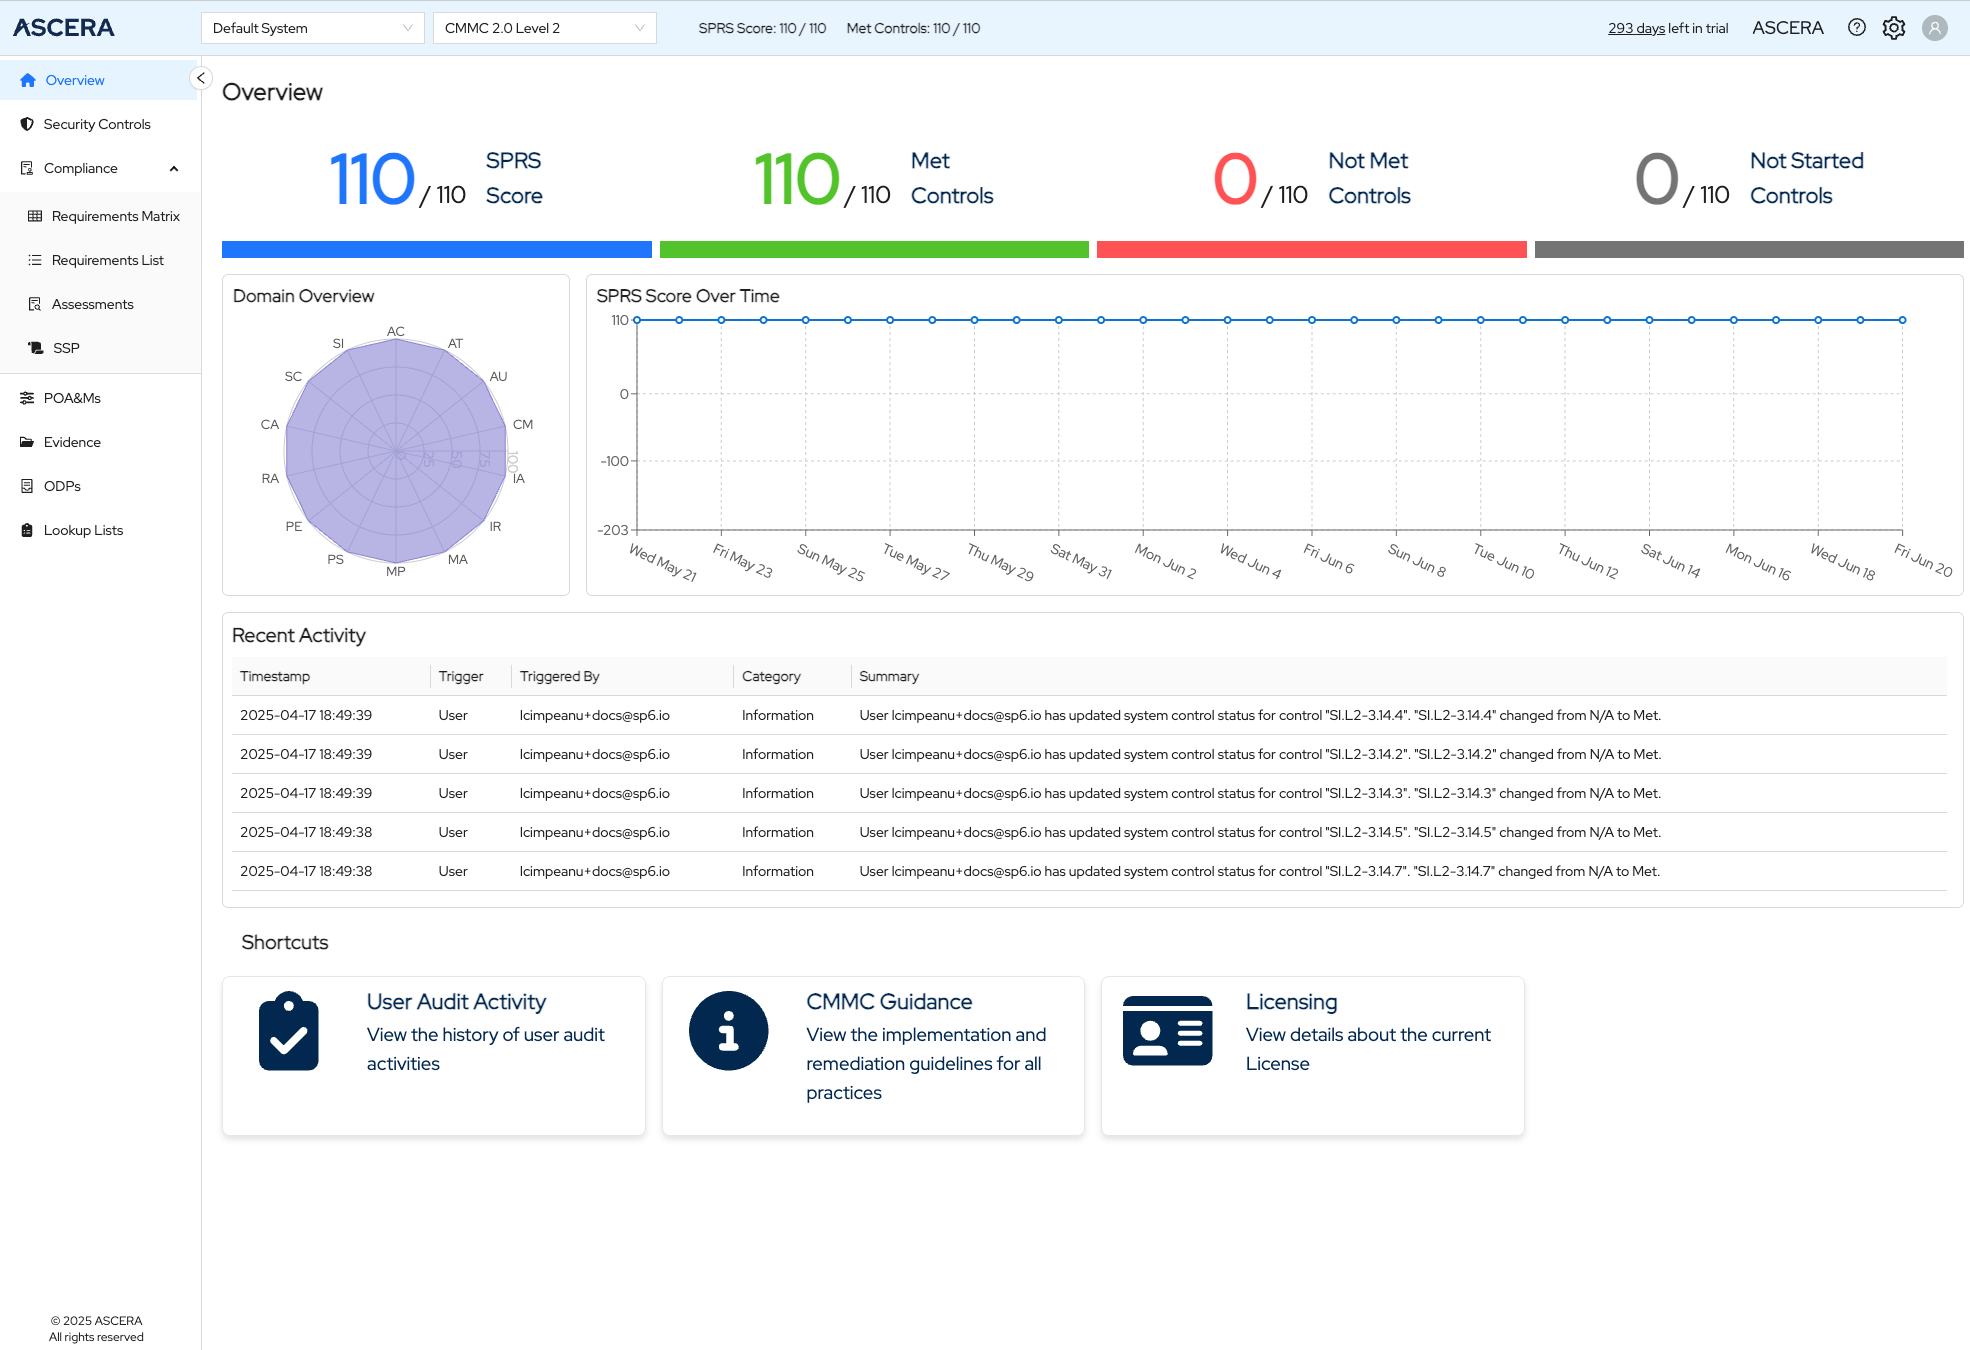
When you first enter ASCERA’s interface, you’ll see the Overview page. This is a centralized hub with near real-time automated stats, alerts, and visual aids to provide quick insights into the current state of your in-scope security and compliance program. It brings together key metrics, activity logs, and visual summaries to help you quickly assess where things stand and take informed next steps.
Persistent Navigation & Header
Left Navigation Menu
Always visible on the left side of the screen, this menu aids users in seamless navigation throughout the app, enabling swift transitions to various sections of the solution as needed.
Header Controls
-
System Selector – Choose the system you'd like to work on.
-
Framework Selector – Switch between supported frameworks.
-
SPRS Score & Control Summary – When applicable, shows the current SPRS Score and the number of Met Controls out of the total.
-
Tenant Name – Displayed prominently to show the current tenant.
-
Documentation Link – Direct access to help docs.
-
Gear Icon – Opens a menu with access to:
- Settings
- Users
- Systems
- Connector Profiles
- Audit Logs
-
User Icon – Opens a dropdown for user-specific actions:
- View user email
- Change password
- Switch between light and dark mode
- Log out
Control Status Summary
The statistics at the top of the page provide a real-time snapshot of your compliance status based on your current system data. Displays counts of:
- Met controls
- Not Met controls
- Not Started controls
Also includes the SPRS Score (if applicable), offering a snapshot of current compliance performance.
Domain Overview
A visual summary of progress across different domains. Each domain is represented as a spoke on the radar chart, with completion progress plotted per domain.
- Click a domain name to go directly to the Controls List, filtered to that specific domain.
SPRS Score Over Time/Control Status Over Time
Visible only for frameworks that use the SPRS scoring system.
A line chart showing changes in your SPRS Score over time, helping to visualize trends and measure the impact of compliance efforts.
For frameworks that don't use the SPRS Score, the Control Status Over Time chart is visible. This is a bar chart that helps you understand trends and assess the impact of remediation efforts or changes in your environment.
Recent Activity
A real-time activity log table showing the latest compliance-related events and updates across your system. This ensures full traceability and visibility into changes impacting compliance.
Shortcuts
A set of helpful quick links to essential resources:
- User Audit Activity – View detailed audit logs
- CMMC Guidance – External link to authoritative CMMC documentation
- Licensing – View and manage licensing information
Usage Tips
- Use the Framework and System Selectors in the header to toggle the context you're working in. The Overview page will automatically update to reflect the selected system and framework.
- Use the radar chart to quickly drill down into specific problem areas.
- Monitor SPRS Score Over Time chart to verify that improvements in your environment are having the intended effect.
- Check Recent Activity table to stay on top of user actions and system events that may impact your compliance posture.
- Leverage Shortcuts to jump straight to high-value areas without navigating through multiple pages.